We are in bearish mode on AUDUSD currency pair
Here is the illustrations and snapshots Audusd forecast and technical analysis for may 5 2014
AUDUSD forecast and Technical analysis
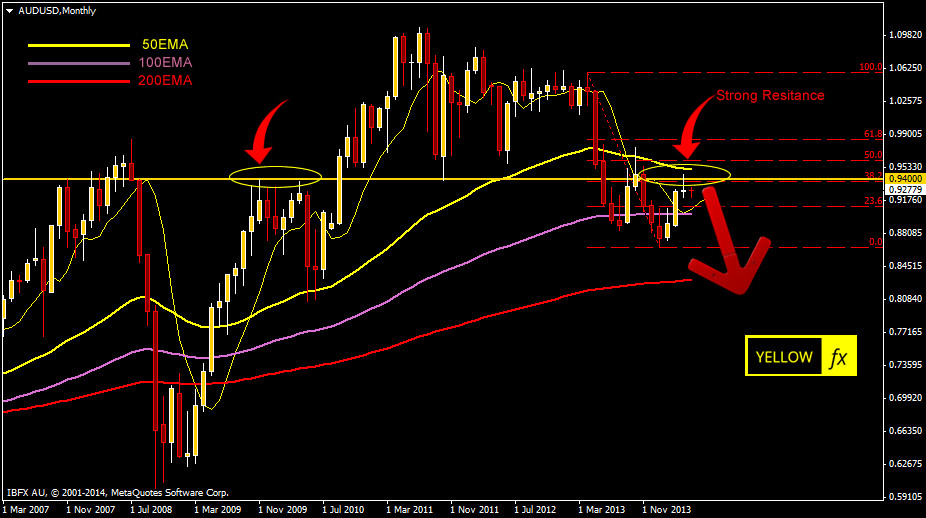
On monthly chart we can see that AUDUSD has been failed to break the strong resistance level, that is 0.9400. New monthly candle opened just below that critical level 0.9400. So we are still on bearish mode on AUDUSD pair.
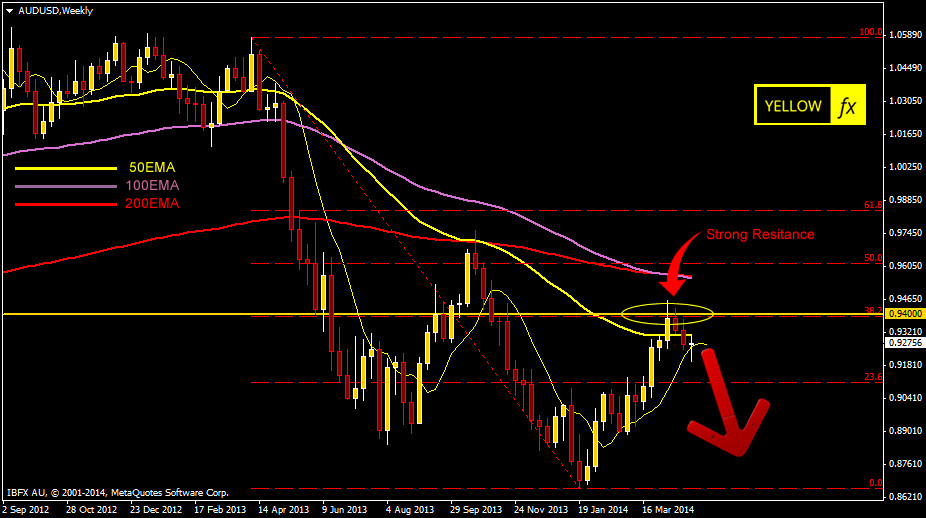
On weekly chart we can see that 0.9400 resistance level has been established and last two candle clearly beat the last bullish candle. So on weekly we are strongly on bearish mode.
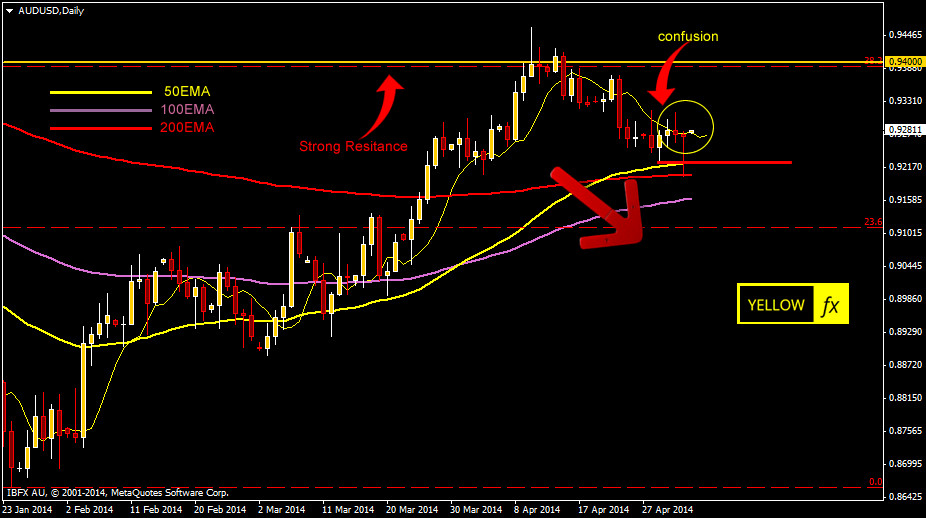
On daily chart we can see a confusion. It shows us a strong support that is 200 EMA. We have drawn a red line on this daily chart. If market can clearly beat this line then AUDUSD will go to a long term bearish trend.
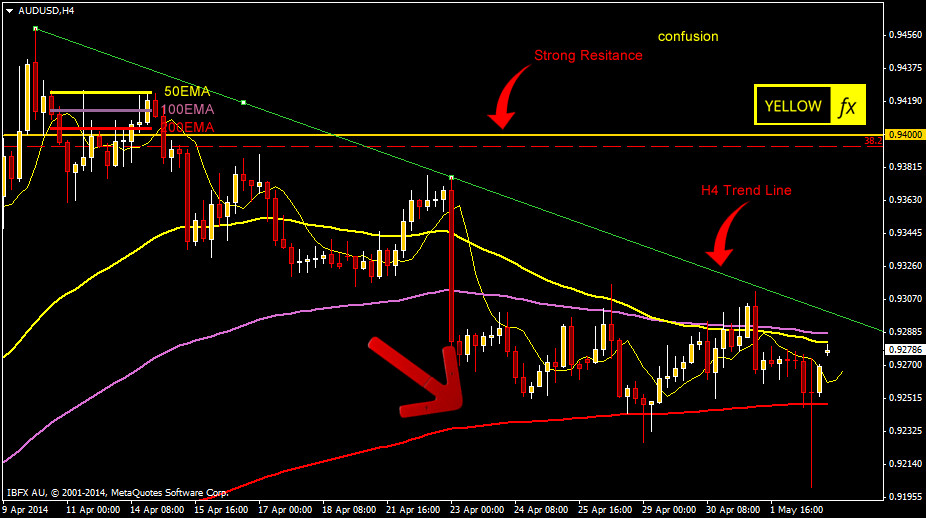
On H4 chart we can see a bearish trend line, which is still in safe position for short trade.
On Audusd bearish trend we have only one problem that is 200 EMA support on daily chart and rest of the charts are showing us a clear bearish trend.