We are in bullish mode on GBPUSD currency pair
Technical analysis for GBPUSD

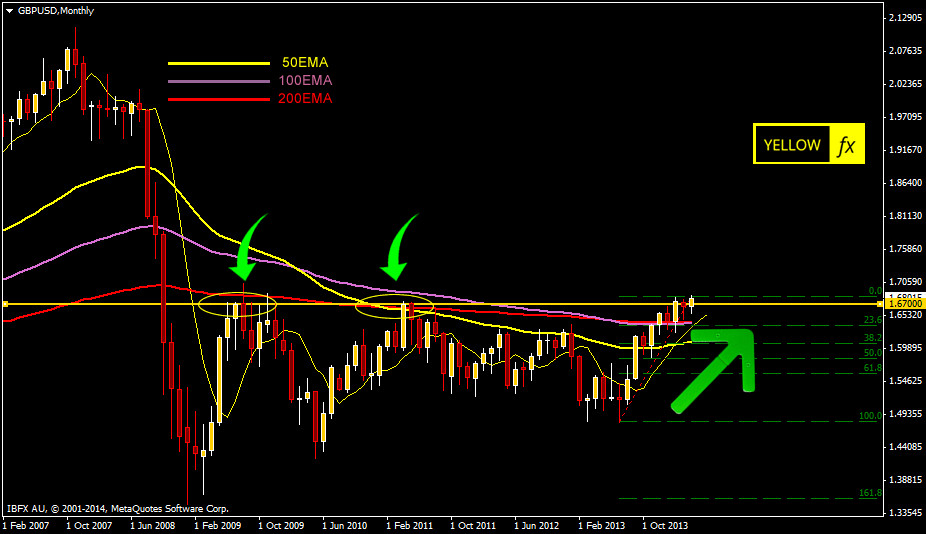
On monthly chart GBPUSD is just breaking a strong resistance point 1.6700. We have to wait till the end of this month, if the next month candle opens above the 1.6700 line it will give us an indication for stronger GBPUSD in the coming 1 or 2 months.

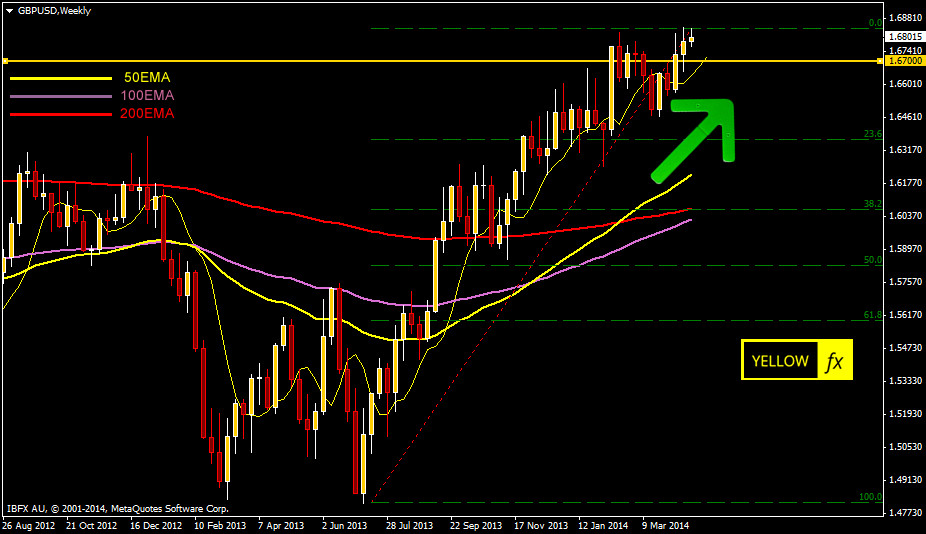
Weekly charts already confirmed that GBPUSD passed the critical 1.6700 line and the weekly candles are strongly bullish.

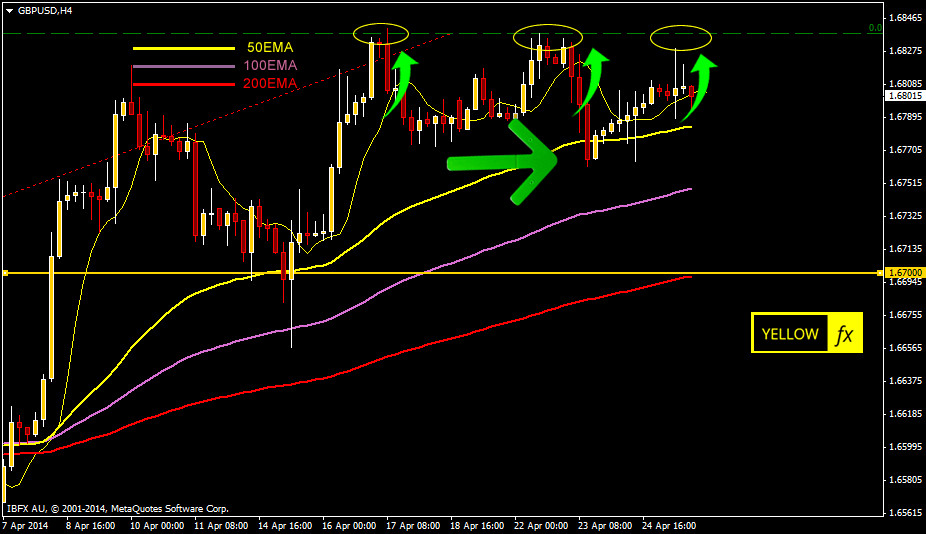
If we consider the H4 chart it seems a ranging situation. Its trying to 1.6840 level for the third time. But longer time frame is telling us the actual story. It might fall a bit but for us GBPUSD is strongly bullish.