We are in bearish mode on NZDUSD currency pair
Here is the illustrations and snapshots for NZDUSD Forecast and technical analysis December 15 2014.
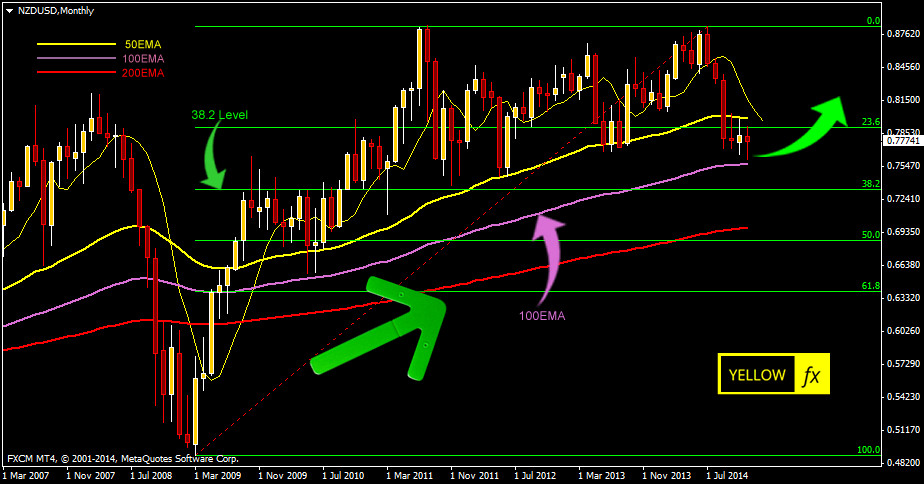
NZDUSD monthly technical analysis and forecast
On the monthly chart of NZDUSD pair we can see that the pair is unable to break the monthly fibo 23.6 level and currently holding its price below the fibo 23.6 level. We are expecting that the current down trend will continue till the monthly fibo 38.2 level. So till it breaks the fibo 23.6 level or touches the fibo 38.2 we will be bearish on this particular pair.

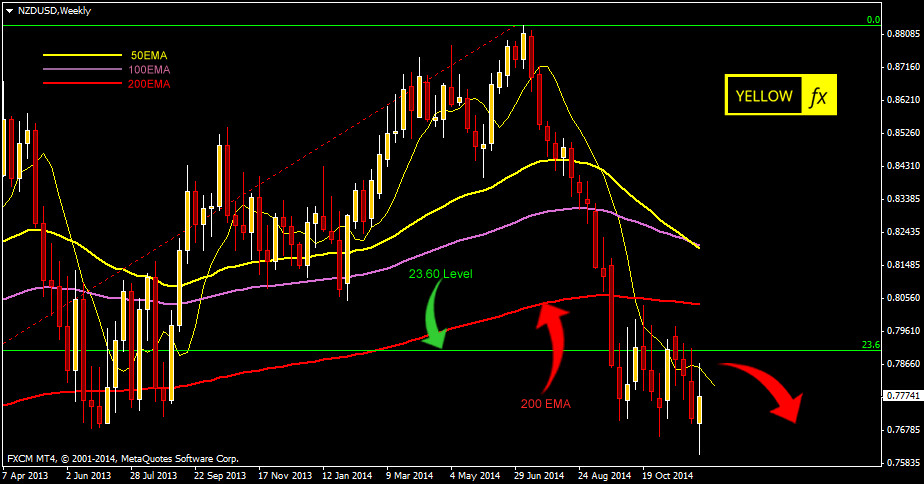
NZDUSD weekly technical analysis and forecast
The last weekly candle is unable to break the previous bear candle. So we are expecting a fall this week.

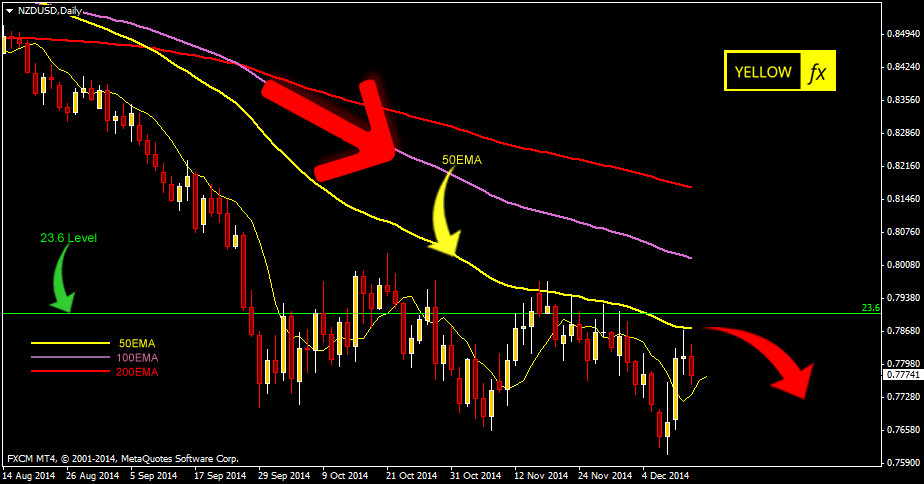
NZDUSD daily technical analysis and forecast
If we consider the last two day candles we can see that market is not firm to go upward its giving indication to a start of fall again.

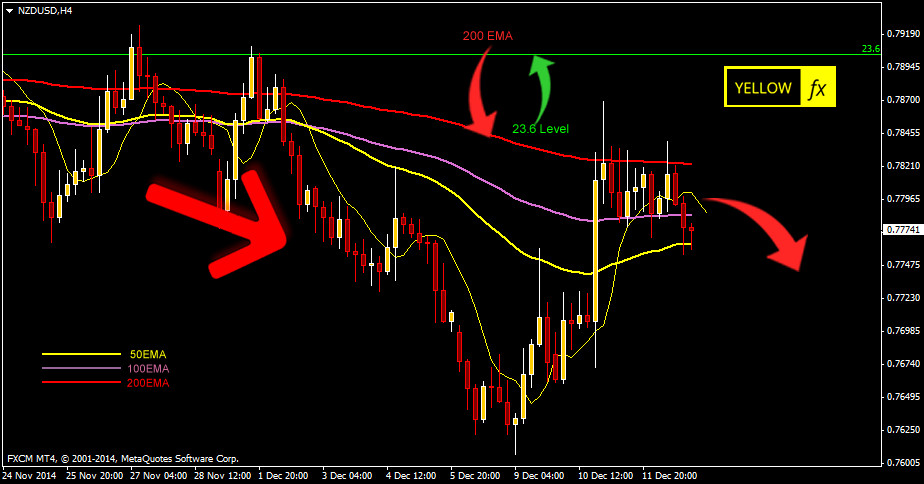
NZDUSD daily technical analysis and forecast
The h4 chart gives us a nice confirmation of future downtrend on NZDUSD currency pair. In fact right now its a right time to go for short again.
