We are in strong bullish mode on NZDUSD currency pair
Here is the illustrations and snapshots for NZDUSD Forecast and technical analysis May 5 2014
NZDUSD Forecast and technical analysis May 5 2014
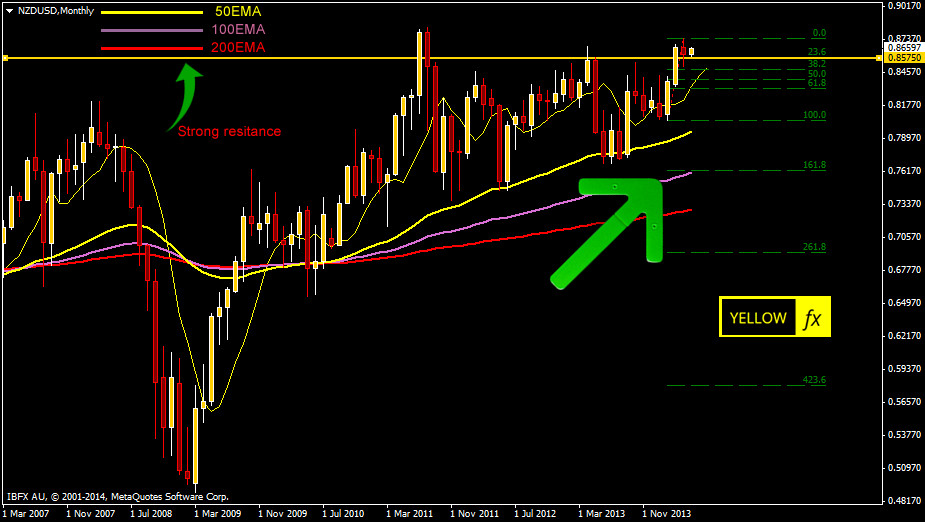
On monthly chart we can see the NZDUSD currency pair clearly broke the strong resistance level 0.85750 and its established its 0.85750 level as its new support level. 0.85750 level is also a critical fibonacci 23.6 level. Recent interest rate increase also boost its upward rally. The monthly chart gives us clear bullish indication on this currency pair.
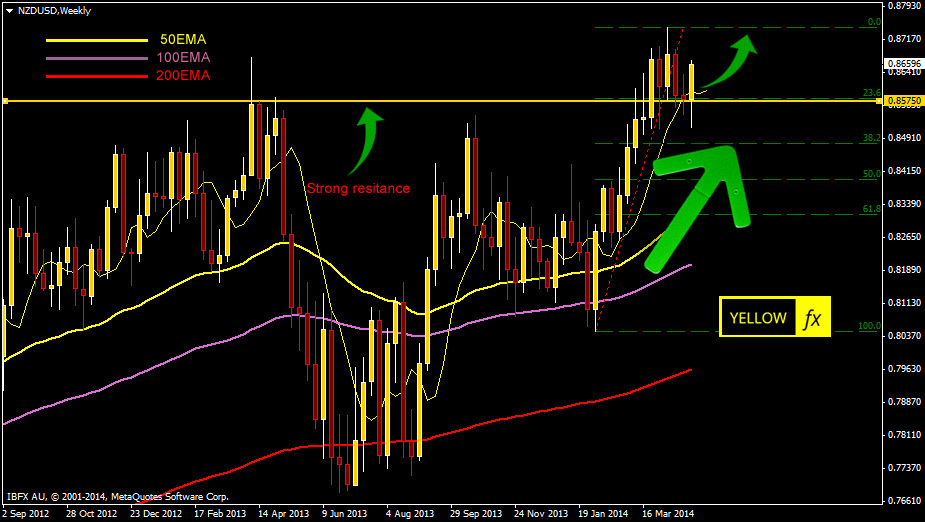
On weekly chart we can see a clear bullish candle, indicates a strong upward move.
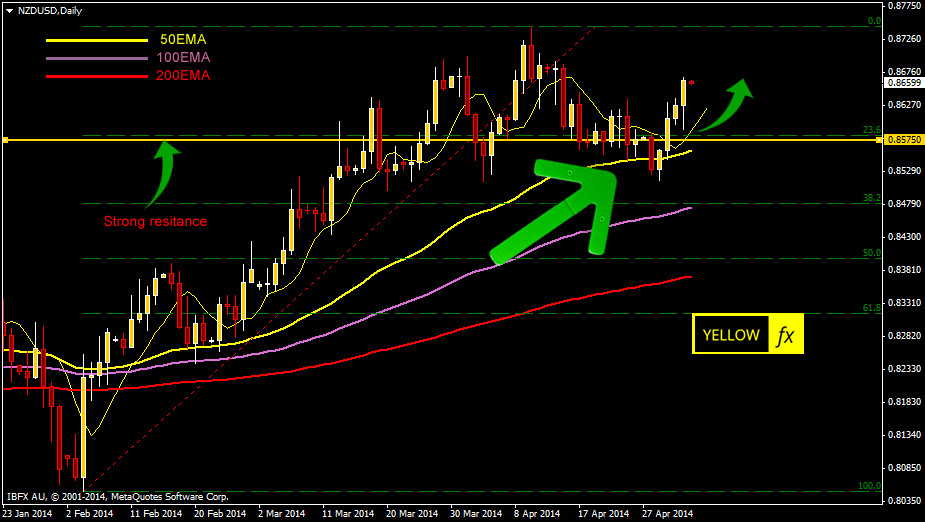
On daily chart we can see that market just bounced from 50 EMA level and couple of nice bullish candle. It is also indicates future bullish move.
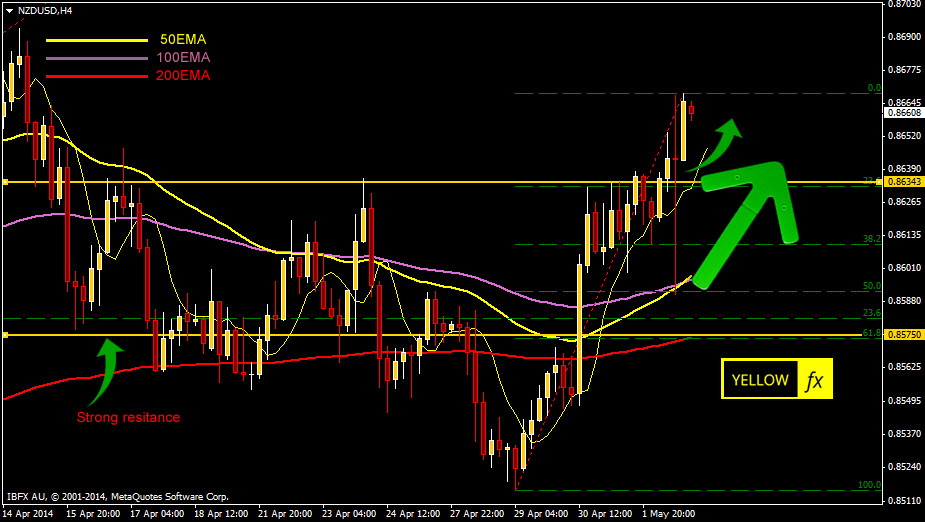
On H4 chart we can see market already started its bullish movement. We need a retrace to make a new long entry.
All the charts in all time frame shows us a strong bullish indication on NZDUSD currency pair.


