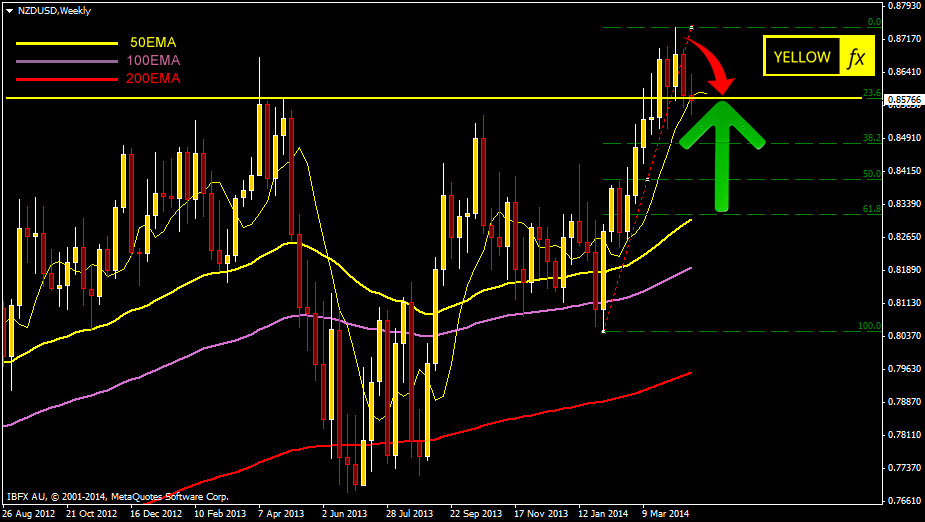
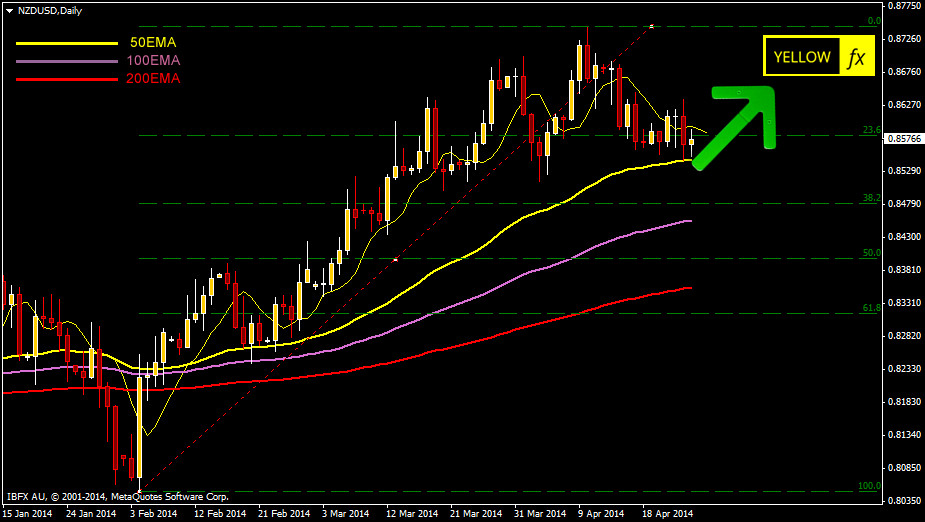
We are in bullish mode on NZDUSD currency pair
Technical analysis for NZDUSD
Tough one weekly chart it shows a slightly fall indication but for me NZDUSD is certainly bullish. Its currently experiencing a Fibonacci 23.8 level resistance on weekly chart.

On the daily chart its just bouncing from the 50EMA and at the same time its experiencing a Fibonacci 23.8 level as a strong resistance.
So technically we can see all the bullish indication on NZDUSD pair.
